Screenshots
Click on any of the following images for a larger view.

|
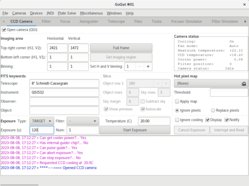
GoQat's main window showing the CCD camera tab when connected to a camera. Real-time camera status information is displayed at top right and messages from GoQat are shown in the message log at the bottom of the window.
|

|
The natively-supported QSI CCD camera configuration window, where camera cooling and other low-level options may be set. Configurations are saved on a per-camera basis; you can specify different options for different cameras.
|

|
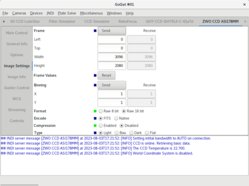
GoQat's INDI client, showing control of a ZWO ASI178 camera.
|

|
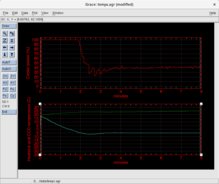
If you install Grace you can plot real-time scrolling strip-charts of the CCD camera cooler power in the upper plot (native QSI only), and chip temperature (for all cameras that report it) and air temperature at the heatsink (native QSI only) in the lower plot. You can customise the Grace plots to alter the size, background colour, plot colours and more.
|

|
GoQat uses SAOImage DS9 for image display, offering a wealth of image analysis tools, including direct access to the image data from IRAF. A colour-coded monochrome image of M57 is shown here.
|

|
GoQat can automatically generate a V-curve to calibrate the autofocus for your optical system using any INDI focuser as well as natively-supported robofocus.
|

|
GoQat's autoguider window. The autoguider has just been calibrated using the star within the blue box. The cross-hairs are rotated to match the orientation of the camera. You can zoom the display, set the background level and adjust brightness, contrast, gamma and gain for those cameras that support it.
|

|
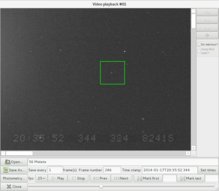
GoQat's video playback window, showing a recording in .SER format of an asteroid occultation with overlay from a GPS time inserter. You can adjust the playback speed, or scroll to any desired frame. Selected parts of frames can be saved as FITS files for further analysis, and you can perform photometry and astrometry on the video recording automatically.
|

|
You can select an image slice and define regions for sky subtraction to see a graph of a section through an image. Ideal for a quick look at a spectrum or as a focusing aid.
|


