Dark signal
Thermally generated electrons accumulate over time in the CCD wells in just the same way as photo-electrons. The majority of the wells behave in a predictable fashion but there are some 'hot' pixels that show greatly enhanced rates of thermal electron production. The rate of production of thermal electrons for all pixels is dependent on temperature and decreases as the temperature is lowered. This investigation examines the characteristics of the 'dark signal'; its spatial variation and its dependency on temperature and time. A dark signal transfer curve can be found here.
Dark signal histogram
The dark signal for this camera is actually very low at low temperatures, so to see the nature of the signal more clearly, a four-hour dark frame at +15C was examined. The dark frame was debiased and a histogram of the pixel values was plotted as shown below.

The majority of pixel values follow a roughly gaussian distribution with mean value just above 4500 ADU. The distribution has a long tail to the right containing the relatively few hot pixels, but just on the right shoulder there lies a smaller population of 'warm' pixels. For the rest of this analysis, the pixels were divided into three groups of 'normal', 'warm' and 'hot' pixels as shown on the histogram.
Pixel masks were constructed based on the four-hour exposure so that all pixels with values below 5200 were assigned to the normal group, those with values between 5500 and 6000 were assigned to the warm group and those above 8000 were assigned to the hot group. These masks could then be applied to any other dark frames to select just the required pixels in those same locations. There is deliberately some space in the histogram between one group and its neighbour to try to avoid contamination of one group by the other. Consequently, there are some pixels not represented in any of the three groups. The proportions of the groups are as follows:
| Pixel type | Number | Percentage |
|---|---|---|
| Normal | 2761573 | 85.9% |
| Warm | 225807 | 7.0% |
| Hot | 52202 | 1.6% |
| Totals: | 3039582 | 94.5% |
Dark signal variation with temperature
The dark frames were bias-subtracted and any 'particle events' due to cosmic rays or radioactive decay from elements in the CCD cover glass (see the review by Richard Berry; also see below) were masked off and are not included in the analysis. Plots of the variation of dark signal with temperature are shown below on linear and logarithmic axes. To assess any spatial variation, the normal pixels were analysed in six separate square areas 200 pixels on a side spaced in two rows across the chip. Each black point represents the mean value in each such area (although they are hard to tell apart). The red points represent the mean value of all warm pixels. Following the example in Richard Berry's review, the hot pixels are represented by six individually selected pixels (these were chosen so as not to be fully saturated, even in the four-hour exposure).

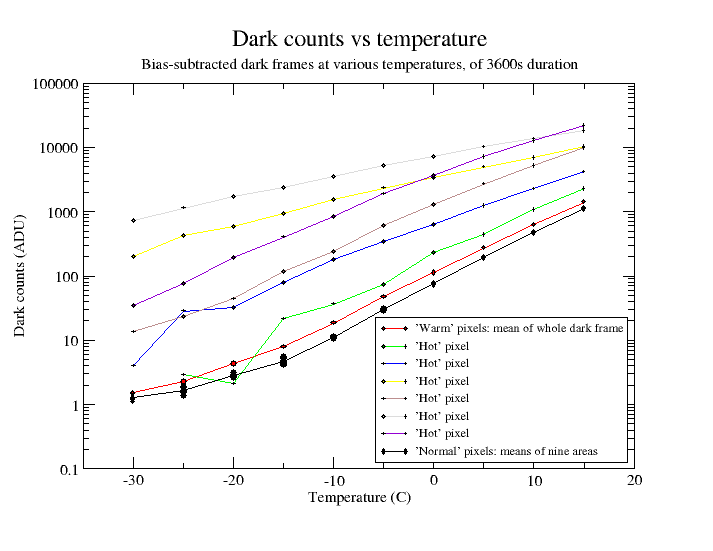
All groups of pixels show dark counts that increase in an apparently exponential fashion with temperature. The hot pixels show extreme behaviour but are few in number. Analysis of the 1-hour exposure at a typical operating temperature of -20C suggests that about 1000 pixels (0.03%) have counts between 0.5 and 1.0 ADU per second, 280 pixels (0.009%) have betweeen 1.0 and 2.0 ADU per second, 80 pixels (0.0025%) have between 2.0 and 4.0 ADU per second and about another 80 have more than this, with just a very few extremely hot pixels. On the other hand, the majority of pixels (the 'normal' group) have a mean dark signal of only about 2 ADU per hour! At the lowest temperatures, the estimate of dark signal is so low that it is subject to some uncertainty in the bias frame subtraction.
The Kodak document "CCD Image Sensor Noise Sources, MTD/PS-0233, Revision 2.1" gives the following equation for the temperature dependence of dark signal D (in electrons per pixel per second):
where:
A is the pixel area in square centimetres (4.62E-05),
Id is the dark current measured at 300K in nano-amps per square centimetre (7.0E-03),
Eg is the bandgap energy of silicon in units of eV at temperature T,
T is the temperature in Kelvin, and
k is Boltzmann's constant in eV/K (8.617E-05).
The following graph shows mean counts per pixel per second for pixels in a 100 pixel square region of each of the one-hour dark frames, after de-biasing and masking of particle events. The area was selected to avoid significant numbers of hot pixels. The Kodak equation is shown plotted as the green line, after adjusting for an assumed gain of 1.33 e/ADU. The fitted value for the bandgap energy of 1.53 electron-volts is a little higher than the true value. Kodak's document does give an equation for the variation of bandgap energy with temperature but this introduces a shallow downward curve in the opposite sense from the measured data.
The magenta line shows the expected fit for a doubling of dark signal with temperature every 6K, drawn arbitrarily to pass through the T = -20C point.
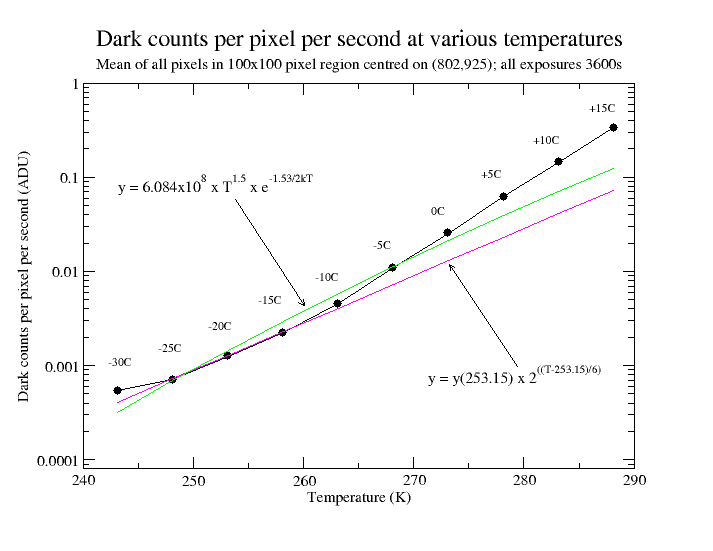
Data from the graph are tabulated below after conversion from ADU to electrons, with the values found by Richard Berry shown for comparison. There is generally very good agreement between the two sets of data.
| Temperature (Celsius) | Mean dark current (e/pix/s) [This work] | Mean dark current (e/pix/s) [R. Berry] |
|---|---|---|
| -25 | 0.0007 | 0.0010 |
| -20 | 0.0013 | 0.0013 |
| -15 | 0.0022 | 0.0016 |
| -10 | 0.0046 | 0.0030 |
| -5 | 0.0110 | 0.0100 |
| 0 | 0.0256 | 0.0800 |
Dark signal variation with time
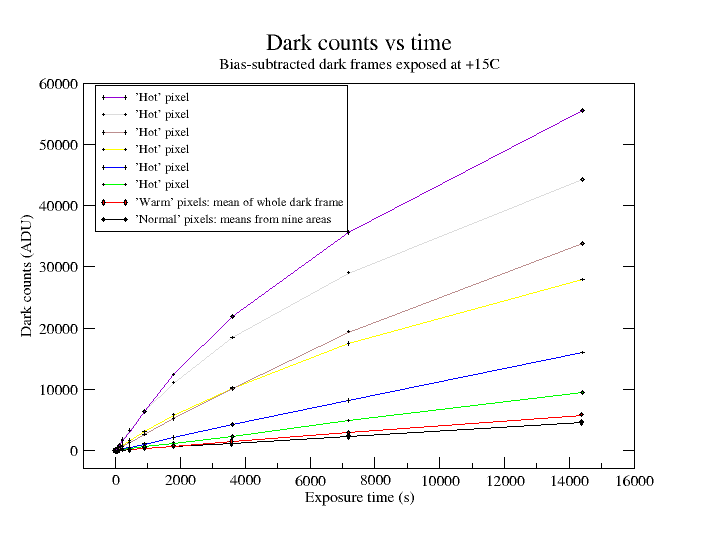
The graphs below show the variation of dark signal with time, on linear and logarithmic axes. A CCD temperature of +15C was chosen to give a respectable signal and the dark frames were bias-subtracted. The pixels are separated into the same normal and warm groups as before, with the same hot pixels representing the 'hot' group. The values for hot pixels are not shown on the logarithmic graph for dark exposures below 10 seconds because excessive scatter made the graph confusing. The kink just after 2 seconds may arise from uncertainty in the bias subtraction for that frame.
The dark signal in the hottest of the hot pixels shows a declining rate of growth with time, whereas the normal and warm pixels behave in a much more linear fashion. Dark frames should be of the same exposure time as the light frame from which they are to be subtracted; scaling linearly from another time is inappropriate because of the non-linear behaviour of the hot pixels. It is assumed that the behaviour with time of the normal, warm and hot groups of pixels is similar at other temperatures.

Particle events
The image below right shows a 300 pixel square section from the hour-long dark frame taken at -30C. The particle events can be seen as blobs scattered across the image; the individual white specks are hot pixels. To analyse the events, the hot pixels were masked off and the groups of pixels affected by each event were automatically extracted. The maximum value for each group was found and is displayed as a histogram at lower left.
The majority have peak values of one to two hundred ADU (roughly the same order as the shot noise in typical flat-field frames). Over the course of the hour-long exposure, there were 745 events with a peak value of 100 ADU or more, 221 events with a peak value of 500 or more and 84 events with a peak value of 1000 or more. About 18500 pixels were affected in total, equivalent to 0.6% of the total area. On average, there were about 20 pixels per event and about 15 events per minute across the whole surface of the chip.

